
Introducing Heikin-Ashi Candles
Heikin-Ashi is a modified candlestick charting technique used in technical analysis to highlight the underlying trend of an asset. Instead of plotting raw prices, it uses averages based on the previous period's data; fittingly, the name is Japanese for "average bar."
A bit of history
The technique is traditionally credited to Munehisa Homma, an 18th-century Japanese rice trader from Sakata and the legendary figure also said to have fathered candlestick charting itself. Trading at the Dojima Rice Exchange in Osaka, Homma built a fortune by reading the psychology of the market, making "average bar" charting one of the oldest tricks in the technical-analysis book.
How to switch
Open Settings, find the Candles option, and switch it from Standard to Heikin Ashi. Your choice is saved and applies to the chart instantly.

How to use it
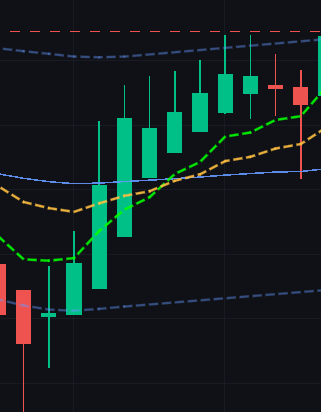
Strong uptrend: consecutive green candles with no lower wicks.
Strong downtrend: consecutive red candles with no upper wicks.
Pros & cons
Pro: excellent for cutting through chart choppiness and helping you hold winning trades during a clear trend.
Con: because the candles use averaged values, the Heikin-Ashi price will not match the actual, real-time market price.
And if you've been away for a while, check out everything else added since launch: Coach Mode, Pre-Trade Check, Trade Replay, and more. Thanks for trading with us!