Tuning & Testing
This post is a little offbeat. I thought it might be interesting to see how Parksaurus has changed since entering Early Access.
Every time a major tuning change is introduced into the game we run all-day simulations. Essentially this is for two reasons:
- To see if the game tuning is having the desired effect
- To identify any unforeseen issues
Money
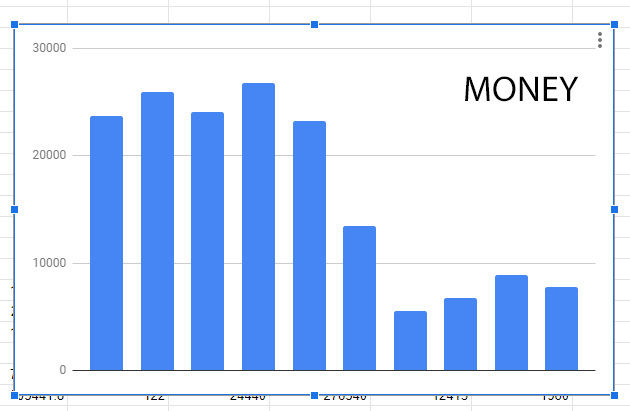
This graph shows how much money an “average” park made over the lifetime of the game so far. You can see when Parksaurus entered Early Access that money was pretty easy to make. In response to your feedback we started to tune this back, and then REALLY tuned this far back – seen as the sharp drop. Too far! With more tuning, we slightly increased the money generation and feel pretty happy where we are now.
Garbage
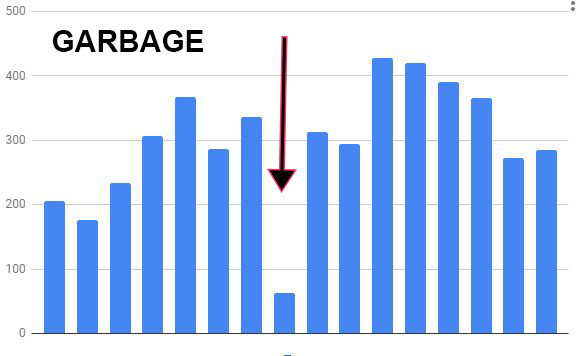
I find this graph a cool example of how our simulation system identifies problems. This graph shows how much garbage an “average” park generated. You can see the sharp drop in the garbage after one of our simulations (shown with arrow). This led us to identify guests were not dropping garbage because they were getting stuck on the navigation mesh!
Waiting in Line
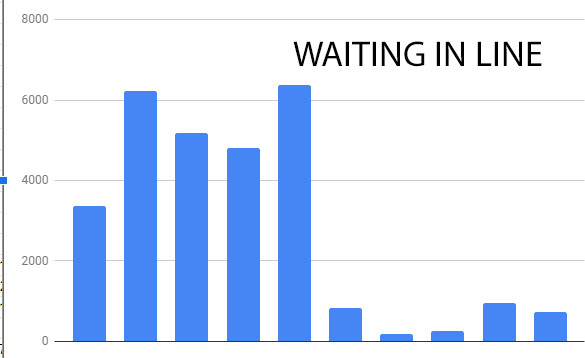
This graph demonstrates the constant (any often unseen) optimizations we are always trying to implement into the game. This graph shows the time spent waiting in line on “average” for guests at the admission booth. That sharp drop occurred when we made a custom hybrid navigation system. This is how we verify improvements!
Poop
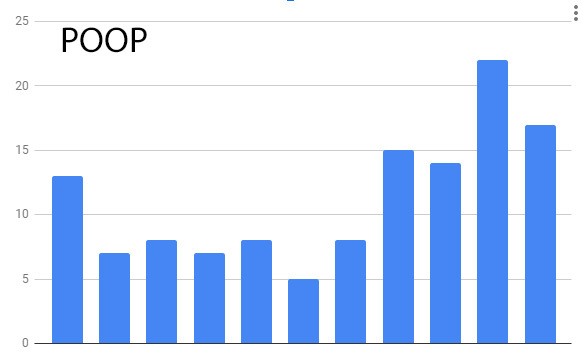
Finally, this graph shows how much poop dinos created on “average” over the lifetime of the game. Why did this increase as development went on? We actually have no idea. The dinos are living AI entities so who knows.
And, if you got this far, here is a little sneak peek a toy we’re currently working on, with many more to come!:
Thanks. Xoxo
Here are a few ways to follow us:
Steam
Discord
Twitter
Mailing List
Facebook
Roadmap and Feedback Forms
Disclaimer: Any crazy features we write about might change during Early Access